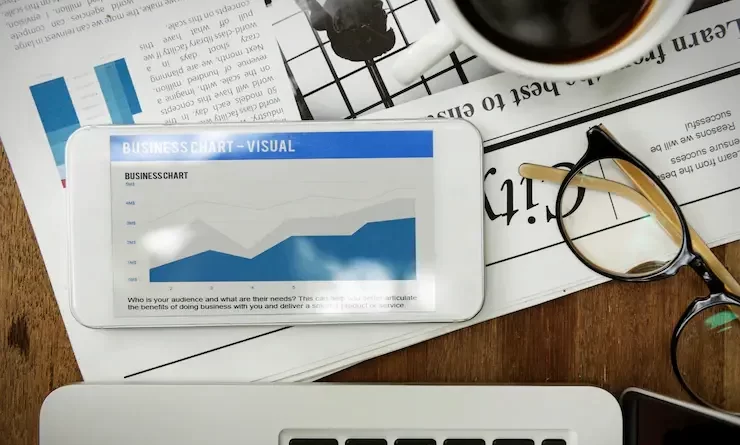
Benefits of Using Data Visualization for Your Big and Small Businesses
Businesses must find better ways to make sense of the ever-increasing volume and diversity of data accessible today. And this is where data visualization comes in handy. Companies may acquire a better understanding of their data sets by visually displaying them in graphs and charts. This can lead to more accurate insights and data-driven decisions. Let’s dive deep into the theme and shed some light on the best things about making data virtualization solutions a part of your company’s operation.
1. Ensure Data Accessibility
Data visualization solutions ensures the accessibility of data insights to a broader audience. Not everyone has the expertise or motivation to delve deep into complex stats and extract meaningful patterns, but anybody can glance at a chart or graph and comprehend how different aspects compare or contrast. Thus, custom data visualization translates the data into a form that everyone can understand with ease.
2. Unlock Key Values
The more data you have, the more difficult it might be to identify the most important insights. Rigorous statistical studies can provide answers, but only if you know what questions to ask – and you have a statistician, data analyst, or data scientist on your side. Data visualization software, on the other hand, may assist executives and nontechnical business people in determining what information is important at a glance, allowing them to swiftly identify areas that require additional investigation.
3. Share Key Stats & the Story Behind It With Others
Not everyone is comfortable with a raw data table. Fortunately, data visualizations make it simple to deliver data insights to any audience. Even when raw data expose vital information, such as a critical performance metric, displaying that same information in context gives a more comprehensive story that everyone can understand.
4. Read the Big Picture
Data visualization solutions allow you to put your numbers in the broader context. They can highlight patterns in complicated data that would otherwise be difficult to read, giving you and your audience a greater understanding of the insights and overall picture.
5. Build a More Engaging User Experience
Essentially, the first data visualizations were pretty nice graphs, but nothing more than that. However, modern data visualization technologies take static works to the next level, helping users to gain a deeper knowledge of their valuable data assets. Visualization might take the form of an interactive chart that makes it easier for you to drill down into fascinating findings. Furthermore, with embedded interactive analytics experiences, users can delve into the data and build visualizations on their own within current tools or applications – no coding skills necessary.
6. Get Ahead of Bottlenecks & Roadblocks
A stumbling block is something that hinders or delays your progress. Data visualization can assist in identifying bottlenecks and other roadblocks before they occur. For example, you may see that production statistics are high until a certain point in the process, which aids in identifying the issue and addressing it in a timely manner.
7. Ensure Automated Reporting & Contextualised Data
Artificial intelligence and machine learning technologies can improve the understanding and use of information. Some solutions support and integrate such technologies into their visualization solutions to increase the accuracy of findings over time via auto-generated comparisons, alerts, explanations, and more.
8. Keep an Eye on Emerging Tendencies
One of the most common applications of data visualization is to spot upcoming trends. When data is displayed over time, for example, it’s easy to see what’s going up and what’s going down, how frequently numbers fluctuate, and where the peaks and troughs are. You may gain a better understanding of growth, spot lulls that require attention or discover spikes in KPIs that require more investigation.
Wrapping up!
Data visualization enables salespeople, marketing teams, and corporate leaders to quickly spot patterns in massive amounts of disorganized data. Organizations may successfully track not just the performance of their sales dept but also business circumstances and marketing trends by employing visual data discovery tools. Take your company to the next level by employing modern data visualization solutions!

