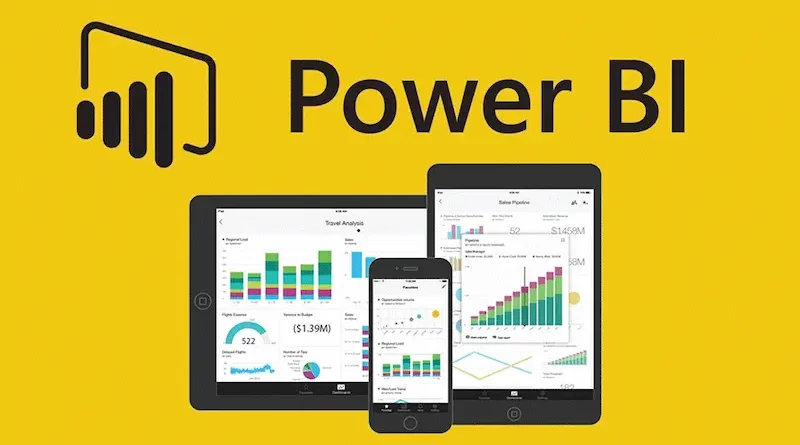
Getting Started with Power BI: A Step-by-Step Guide to Harnessing its Analytical Capabilities
Organizations across a wide range of sectors are continually looking for methods to turn raw data into meaningful insights in today’s data-driven environment. Microsoft’s potent business intelligence tool, Power BI, has become a top tool for data analysis and visualization. With its user-friendly interface and powerful analytical tools, Power BI enables users to get valuable insights from their data and facilitates reasoned decision-making. You may follow along as we step-by-step lead you through installing Power BI, preparing your data, generating interactive dashboards, and sharing results.
I. Installing Power BI:
Installing the Power BI Desktop application is the first step in starting your Power BI adventure. The installation is available for download from the official Microsoft website. To install Power BI on your PC after downloading, follow the installation wizard’s instructions. A complete solution for generating, modelling, and visualizing data is the Power BI Desktop. In addition, you can view your reports and dashboards on the move using the mobile and browser versions.
II. Connecting to Data Sources:
You must link Power BI to your data sources after installation. Data connections supported by Power BI include those for Excel sheets, SQL databases, SharePoint lists, and cloud services like Azure. By establishing connections to your data sources, you can import and refresh data within Power BI, ensuring that your reports and dashboards always reflect the latest information.
III. Data Preparation and Transformation:
You may start preparing and converting your data within Netsuite Power BI as soon as your data sources are linked. You may clean, shape, and merge numerous data sets with the Power Query Editor, an integrated data transformation tool. You may carry out a number of actions using its user-friendly interface, including eliminating duplicates, dividing columns, merging tables, and performing transformations like data filtering, sorting, and aggregation.
IV. Creating Visualizations:
Once your data is ready, use Power BI’s extensive collection of visualization tools to build effective visualizations. Power BI provides a variety of graphs, charts, and other visual components to help you effectively portray your data. From bar charts and line graphs to maps and scatter plots, you can choose the visualization types that best showcase your insights. Additionally, Power BI allows for interactive exploration of data by enabling drill-down, filtering, and slicing options within visualizations.
V. Designing Interactive Dashboards:
Making dynamic dashboards is one of Power BI’s unique capabilities. Dashboards give users a unified view of important data and insights, enabling them to quickly assess performance and make wise decisions. To create aesthetically attractive dashboards, you may use Power BI to drag and drop visualizations into a canvas, organize them as you see fit, and alter the layout and colors. Additionally, you may use filters, slicers, and drill-through actions to improve interaction and let users dig deeper into the data.
VI. Applying Advanced Analytics:
Power BI provides sophisticated analytical features that go beyond straightforward data visualization. You may carry out intricate calculations, develop unique measurements, and design interactive reports with dynamic computations thanks to technologies like DAX (Data Analysis Expressions). Additionally, Power BI interfaces with Azure Machine Learning, allowing you to use predictive analytics and machine learning models to glean important patterns and insights from your data.
VII. Sharing and Collaboration:
Power BI makes it simple to share your appealing reports and dashboards with others. Your reports may be exported as files, like as PowerPoint presentations or PDF documents, or published to the Power BI service. The Power BI service enables collaboration by allowing you to share dashboards with specific individuals or groups, granting them access to view and interact with the reports. To alert stakeholders of updates or changes to the data, you may also schedule data refreshes and set up automated notifications.
VIII. Governance and Security:
Security and governance become essential components of any data analysis platform when working with sensitive data. You can manage who has access to reports, dashboards, and data sources thanks to Power BI’s strong security features. Role-based security may be configured to control who can see, edit, and publish reports. A seamless user authentication and centralized access control are made possible by Power BI’s integration with Azure Active Directory. To safeguard data privacy and regulatory compliance, Power BI also provides data encryption, compliance certifications, and auditing capabilities.
IX. Extending Power BI with Custom Visuals and APIs:
By using APIs and combining unique visualizations, Power BI gives users the freedom to expand its functionality. You may improve your visualizations and experiment with different ways to show data by using the extensive selection of custom and best power bi visuals available in the Power BI marketplace. Additionally, Power BI exposes APIs that allow programmers to incorporate Power BI features into unique apps or automate data operations, opening up countless options for customizing the tool to meet your unique requirements.
X. Continuous Learning and Community Support:
It’s crucial to interact with the active Power BI community and take use of the various learning materials as you start your Power BI journey. To assist you in increasing your proficiency with Power BI, Microsoft provides thorough documentation, tutorials, and video courses. The Power BI community forum and user groups are fantastic venues for connecting with other users, getting help, and picking the brains of more experienced users. Additionally, Microsoft often sponsors webinars and events where you can learn from business professionals and keep up with the most recent Power BI capabilities and improvements.
Conclusion:
Power BI is a revolutionary technology that enables businesses to maximize the value of their data and promote data-driven decision-making. You can get started with Power BI by following this step-by-step manual, which covers everything from installation and data preparation to generating interactive dashboards and sharing reports. Remember to take use of the many resources and community assistance offered to keep your Power BI knowledge up to date and at the cutting edge of data analysis and visualization. Accept the power of Power BI and open up a world of useful information for your company.